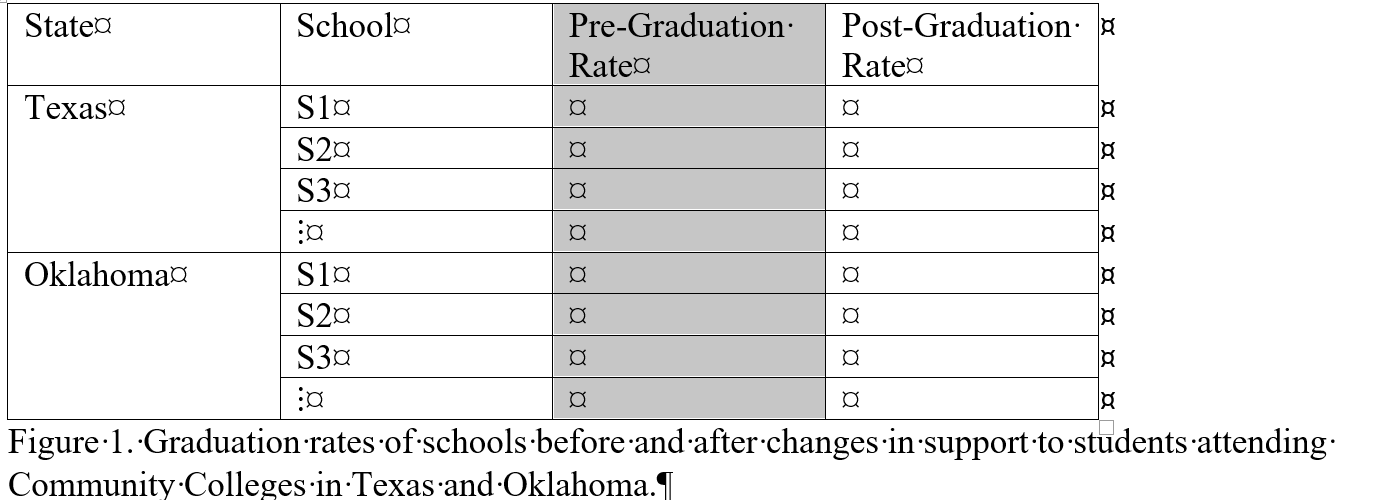
 The above quote and title of this missive is often attributed to Benjamin Disraeli by way of Mark Twain. It seems to imply that statistics anchor the bottom of the untruth continuum. We can all recall instances of people misusing numbers or outright lying with numbers but in trusty hands statistics should help us understand phenomena more clearly. If I tell you that a man doing a certain job makes a lot more than a woman doing the same job you may be vaguely interested. If I show you their pay stubs and one earns $2000 in a two week pay period and the other earns $3000 in the same period now I may have piqued your interest. But it may be more nuanced than that. The one with the $2000 check may be working part time while the other person may be working full time. How many hours? Is there a difference in grade level? If so, what does that imply? Did I specify who got the larger check? Was it the man or the woman? Sometimes everything you say can be true but what you leave out makes it misleading or untrue. The most recent case of this “unholy” practice was called to my attention by a friend I was helping with her graduate statistics course. Her assignment was to find an example in the literature of a two-sample t-test. You remember the t-test? We are not comparing chamomile with say Darjeeling. No, we are talking about the statistical procedure where we are comparing two sets of measurements to try and figure out if they are different on some measure of interest. For example, as in the case of the study my student found, the issue was if there was a difference in graduation rates at as a function of new support programs at Community Colleges in Texas and Oklahoma. They used a two-sample t-test to test to see the differences between the two states was statistically significant. Sounds pretty reasonable on the face of it. But, as my tutee astutely detected, there were some major flaws in the procedure. To begin with, they threw out all but fourteen of the schools from Oklahoma because ethnicity data was not included in the data sets and then they proceeded to use a t-test using just 14 schools from Oklahoma even though ethnicity had nothing to do with that part of the analysis. If they didn’t need the ethnicity data, they could have retained all of the Oklahoma schools for their analysis giving them more power and a more representative sample. Their analysis should never have been published. The proper design would have incorporated pre and post data and the Texas vs Oklahoma variable in a classic Split Plot design as in Figure 1 above. While ethnicity is no doubt an important variable, they did not have sufficient data to include it in their analysis. The article was rife with statistical errors. Be aware that publication does not mean an article is free from either error or artifice. Read every article carefully and look for faulty statistics and reasoning. Whether the errors were committed intentionally or through ineptness an inappropriate use of statistics can lead to erroneous conclusions and sometimes lead to action in a wrong direction. Another recent example of lying with statistic comes from the Mayoral race in Tampa, Florida. It had been alleged that the former Police Chief, then running for mayor, claimed a 70% decrease in the crime rate under her watch as Chief. It has been alleged that she was counting crimes differently under her watch. Instead of counting all of the charges related to an incident as independent crimes, as had always been done before, Chief Castor was allegedly only counting the incident as a single crime, thereby cutting the number of apparent crimes drastically. So, when she reported cutting the crime rate, she was using a different metric which resulted in the appearance of a lower crime rate. Whether she did this wittingly or unwittingly (or at all, as the matter is very unclear at this writing) again we see the inappropriate use of statistics leading to a major misimpression of reality. Applying another old adage,” If it sounds too good to be true it probably isn’t true”, the 70% crime decrease sounds too good to be true. In either of the cases cited above it is unfortunate that there was no one sufficiently versed in statistics to properly review the information before it became public. A proper vetting could have been beneficial in both cases.
1 Comment
Steve Kahane
4/27/2019 11:30:54 am
Some element of garbage in garbage out applies to these examples. However, it often appears that rather than using statistics in the scientific method (follow the data where it leads), statistics are derived, managed and massaged to support a thesis. A good statistician knows the difference. Great points and good examples.
Reply
Leave a Reply. |
AuthorEd Siegel Archives
May 2023
Categories |

 RSS Feed