|
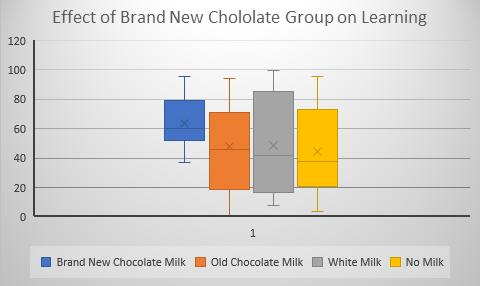
There is an article in the latest edition of Scientific American about the short comings of using standard statistical significance testing as the criterion for publishable results. Without going into all the nuances of significance testing it basically boils down to this. When you do a scientific study or research project you compare a group that receives an experimental treatment to a control group that does not get the treatment. Using an appropriate statistic for the comparison like a t-test or an F-test or a chi square you test to see if the difference is large enough to claim that it is probably due to the experimental treatment. Using an F or t statistic you compare the difference between the experimental and control group relative to the amount of error. Using chi square the difference is compared to expected values. The criterion is usually set so that if the likelihood of statistic is less than .05 (p < .05) it is said to be statistically significant. The p value is supposed to be set prior to the start of the experiment (a priori) and is sometimes set to a more stringent p < .01. You use a statistical procedure because results are rarely clear cut and you generally can’t test everyone in a population. You use a sample to see how things work out So, as an example, and just for fun, let’s say that you want to test your Brand New chocolate milk and on how it effects learning in kindergartners. You take a large (really large) class of say 60 children and split it into three groups. One group gets your brand new chocolate milk. Another group gets some other brand of chocolate milk, the third group gets plain white milk and the fourth group gets no mild at all. Now there are many more groups and procedures that you could want to employ as proper controls but we’re keeping it simple. The learning test how many types of animals each child could correctly identify. Let’s say our results look like the following. Notice that the X’s in the middle of each box indicate the average mean score for that group. The means for the four groups are given below:
Brand New Chocolate Milk 64; Old Chocolate Milk 48; White Milk 49; No Milk 44; Clearly there is something very different about the mean for the Brand New Chocolate Milk. All the other means are in the mid to high 40s and our group of interest is 64! Yet, a statistical test done on the data that created the pretty graph and table of means yielded a probability greater than .05. What are we to think?! Okay, I cooked this data just to get this result but the point is made. This result would never make it into the literature because it was not Statistically Significant! “Give me a break”, you say. I agree, this result should be filed under the category, Suggestive but not Conclusive, and should have a home somewhere in the literature so that it may be followed up on. What about results that go the other way. Data that is narrowly significant and doesn’t seem to have much practical significance because the effect may be small. This too should have place in the literature. The great thing about science is that findings don’t become facts until they are replicated. At least that’s the way it’s supposed to work. Unfortunately, it doesn’t always work. Worse yet sometimes “facts” are admitted to the scientific catalog that simply are not so and sometimes these “facts” don’t die an easy death. Take, for example, the mythology about the evils of dietary salt. Somehow salt became the evil deadly ingredient in our diet, largely on the basis of one faulty study. A review in the Journal Science over 20 years ago clearly demonstrated that salt is not the great evil it had been claimed to be. Yet here we are today still seeing all kinds of ads and literature claiming food low in salt to be more healthful. This may be the topic of a future missive but for it should serve to show that there is an impact of false positives and that once something is incorporated into the truth catalog it’s hard to get rid of. So, what are we to think of statistical testing? It seems as though we have moved far afield. We haven’t moved far afield. Statistical testing was never meant to be the be all and end all of scientific truth it was meant to be used as a tool in guiding thinking about outcome of an experiment or research project. It has evolved to be to become an arbiter of absolute truth and that is the problem. Facts are not easy to come by scientific in research. Our literature is biased by only admitting findings that exceed the .05 criterion. This allows false positives (things that appear to be true but are not) to creep in but not false negatives (things that appear to be false but are not). Some advocate the use of confidence intervals to get around the shortcomings of significance testing but it is only a slight of hand, since confidence intervals are essentially the same thing as a p value and their use adds nothing to our understanding. The only thing that helps to clarify our understanding is more and better research seasoned with a thoughtful use of statistics. If you enjoy reading this journal and would like to be notified as new entries are added go to the contact page and send me your email and I will add you to the list of readers and I promise I will not sell or give away your email address to anyone.
0 Comments
|
AuthorEd Siegel Archives
May 2023
Categories |


 RSS Feed