|
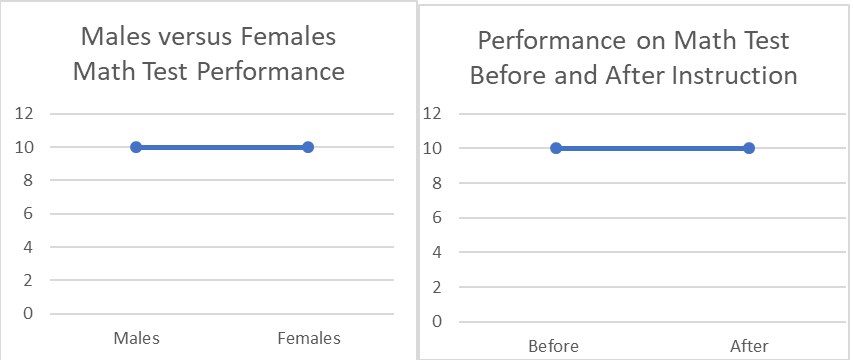
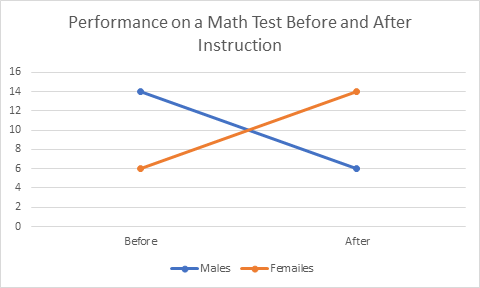
Last month (technically two months ago) I started talking about how much I enjoyed working with graduate students because I learned so much in the process. Of course, I got side tracked talking about regression. So, here, as Paul Harvey used to say, is the rest of the story. I learned about R the open source statistical package through working with a graduate student. I learned about Cohen’s d (the measure of the strength of relationship in analysis of variance) working with a graduate student. I never would have had the chance to employ dummy variables in using regression to do an analysis of variance (nice to know, stupid to do) and so much more. Since I am not active academically other than in helping graduate students and since I no longer belong to any professional associations for statisticians, one of my only ways of keeping current or even remembering my old learnings, is through helping others, be it in their graduate statistics classes or on their dissertations. A case in point is a student, whom I’ll call Kay. I tutored her in her nursing statistics class. She recently called and ask for help with a problem in statistical process control. I have not done anything in process control statistics since I started at Control Data Corporation in 1981! And even then, I had to learn it for the first time to present a model for applying process control to our yearly employee survey to our senior VPs. Deming (the godfather of process control statistics) was spinning in his grave at the thought. At any rate, helping Kay has given me the opportunity to brush up on my knowledge of process control statistics and I understand some of it really well now. There us of course still much to learn. One of the first students I worked with recently, I’ll call her Mandy, had been an employee of mine at one time. She had always given me a hard time about not finishing my doctorate and then she turned around and waited until the last minute to complete hers. By the time she was ready to work on her project her new major advisor had become the heard of the measurement department. He thought it would be fun for her to do her analysis of variance (ANOVA) in a regression framework using dummy coded variables. She panicked and called me. I panicked and read up on it! I had done plenty of regression analyses and ANOVAs and dummy coding, but never all at one time. The coding is simple, and the way it works out is simple for the main effects (main variables) but the interactions between variables are very tricky and we never used the interactions. That’s a very bad thing because it’s often the interactions that tell the story. A simple example of the importance of interactions is provided by the following example. Let’s say I have two groups of students, males and females. I want to test the effects of a certain teaching technique on their math performance. I test them pre and post and get the following two graphs. These figures depict the test scores on the main variables or the main effects of the experiment. Clearly, there are no differences between men and women on the test nor are there differences before and after instruction. However, if we look at the figure below clearly something very dramatic happened as a result of the instruction. Men and women changed places on the test! You will note that the mean score for men is ten both before and after instruction as it is for women so the first pictures are accurate but they mask the interaction effects. It is very important to always look at the interactions in a multi-variable experiment unless you know a priori that there will be no interaction effects. While it’s nice to see that regression can be used to perform an ANOVA for the purposes of showing the relationship between the two techniques it’s always a better idea to do an actual ANOVA if you are doing serious research.
0 Comments
|
AuthorEd Siegel Archives
May 2023
Categories |


 RSS Feed